With the two-stage rocket “The Hound” of the TU Wien Space Team the current altitude record for “experimental rockets built by European student teams” should fall. For this goal one needs a rocket structure as light as possible, which withstands the extreme conditions at the same time. The material used for this has now undergone a thorough analysis of its thermal properties.

Starting Point
According to our simulations, the maximum speed of the upper stage is 5 times the speed of sound (about 5500km/h). At multiple speed of sound, there is a strong warming of the rocket surface. Analytical methods were used to determine the maximum surface temperature. Depending on the approach and assumed variables, however, the result varies greatly. Because we have no clear results, we assume a few 100°C surface temperature. In the current design we use aluminum at the top, as motor housing and at the Fincan. The remaining Airframe consists of a composite material of glass fiber and the high temperature matrix cyanate ester. The named composite material was provided to us by our sponsor – PEAK Technology.
In order to be able to obtain information on the actual temperatures in flight in the event of a successful flight and subsequent finding of the rocket, we have determined the current material parameters in cooperation with the Institute of Materials Science and Technology of TU Wien, Vienna.
For the above conditions, the thermal properties of the matrix are crucial: At which temperature the stiffness of the matrix is reduced so much that a failure of the structure occurs? The temperature at which a polymer goes from an energy state (solid) to an entropy-elastic state (rubbery to viscous) is called the glass transition temperature (GTT or TG).
One way to determine TG is Differential Scanning Calorimetry (DSC).
Differential Scanning Calorimetry (DSC)
The manufacturer of the pre-pregs recommends in the material data sheet the annealing of the components for two hours at temperature of 200°C after curing in the autoclave.
In the first step, we analyzed the change before and after annealing. Figure 1 shows three solid lines and two dashed lines. Solid lines mean that the samples are heated to 400°C the first time, while the dashed lines represent the second run of the analysis.
In Figure 1 we see that the curves have been moved vertically. The absolute value of the heat flow is not relevant for the determination of TG, only the shape of the curve.
The red lines show the heat flow before annealing, blue and green lines after annealing. The samples of blue and green are reasonably identical, which is not surprising because the material samples were made from the same material, in the same autoclave and annealing cycle and come from two different components only.
The peak of the heat flow at a temperature of 138°C could be misinterpreted as TG, but it is believed to be curing or cross-linking residues. The red curve shows a step in the rising curve at about 310°C, which can be interpreted as TG of the untempered sample.
For the annealed sample, TG is expected to be above that of the untempered sample, but in the present case the determination is not entirely clear. The red arrow indicates a weak level of the blue curve, indicating a TG of approximately 370 ° C (see Figure 2 for more detail).
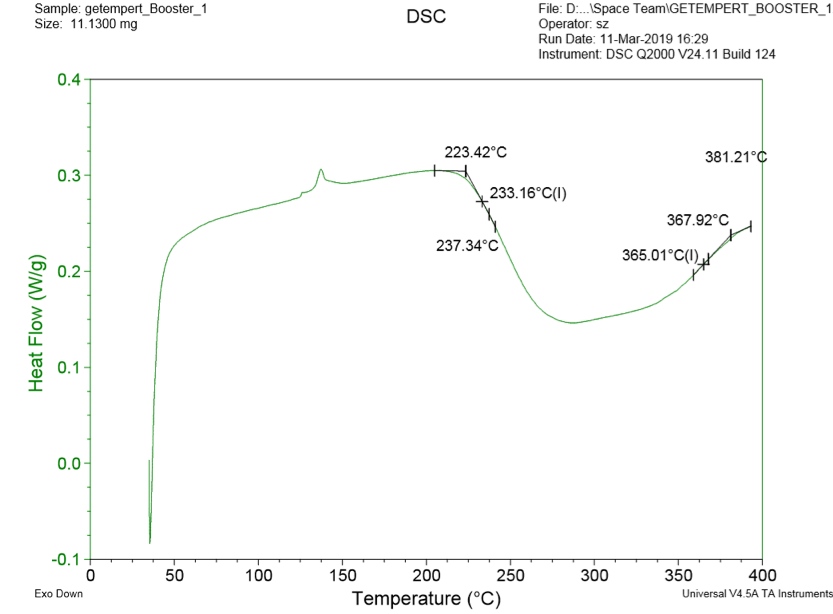
However, what can be said clearly is that annealing alters the texture of the material and minimizes the cross-linking residuals (seen through the smoothed curve).
A second run through the samples by the DSC analysis shows, however, that the annealed sample is not fully cross-linked. As already mentioned, the blue curve of Figure 1 does not show a distinct step that would indicate a TG. The heavy drop at around 400°C is the decomposition processes that take place above TG. The presumed step in the blue solid line (Figure 1), or green line in Figure 2, respectively, is very close to the decomposition temperature. The remaining question is: Is the assumed level a TG or the beginning of the decomposition?
There is no clear answer from this analysis. However, it is certain that TG is above that of the untempered sample and below the decomposition temperature.
Dynamic-mechanical analysis (DMA)
For a clearer statement about the actual TG of the annealed components further analyses were carried out. The manufacturer has determined the material characteristics using the dynamic mechanical analysis (DMA) method as shown in the data sheet (see Figure 3). The DMA determines the course of stiffness over the temperature range.
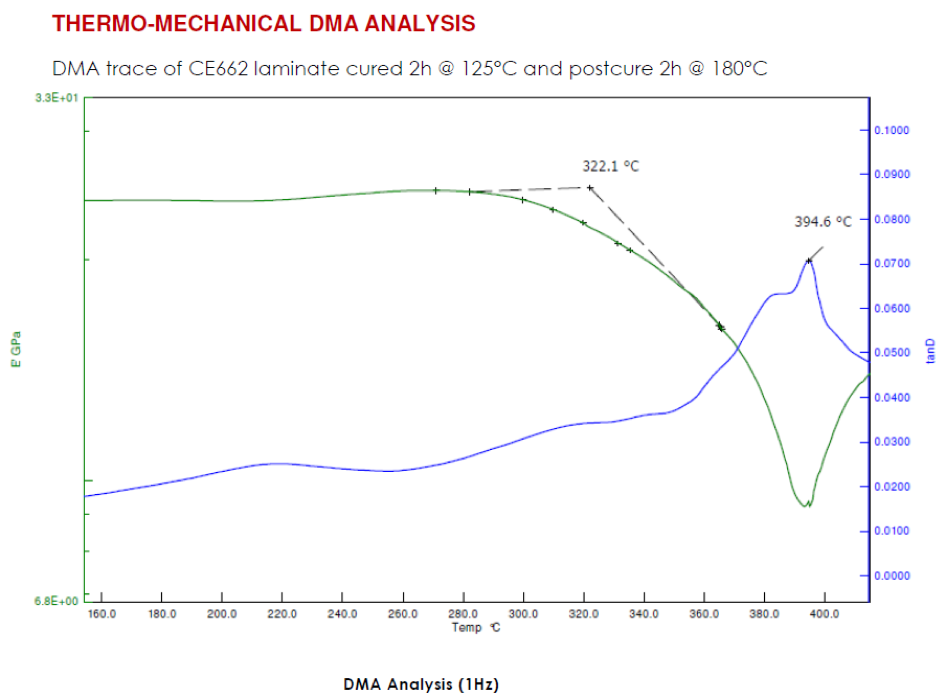
The TG at the DMA can be given as the peak of the loss modulus or the tip of the tanD. The manufacturer has used the tanD. Normally, these two points are close to each other. In our analysis it was 0.6°C (see blue curves in Figure 4 and Figure 5). Furthermore, the curve of the manufacturer seems to be smoother which may be because the module in the present diagram (Figure 3) has a logarithmic scale.
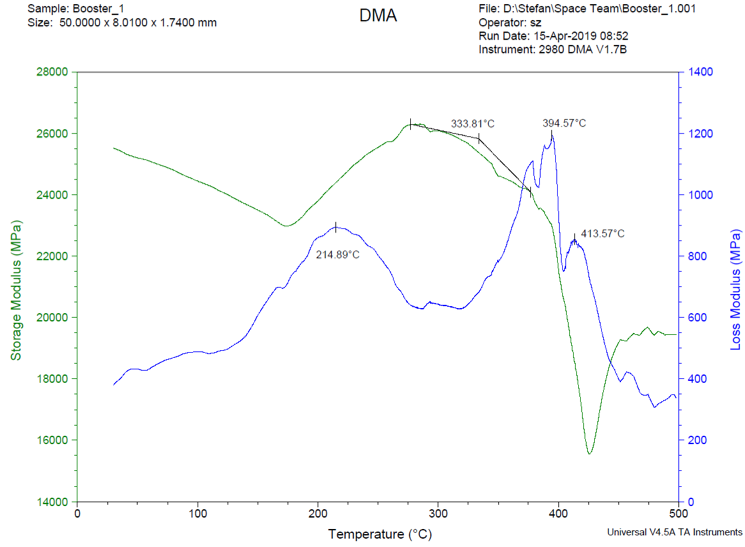
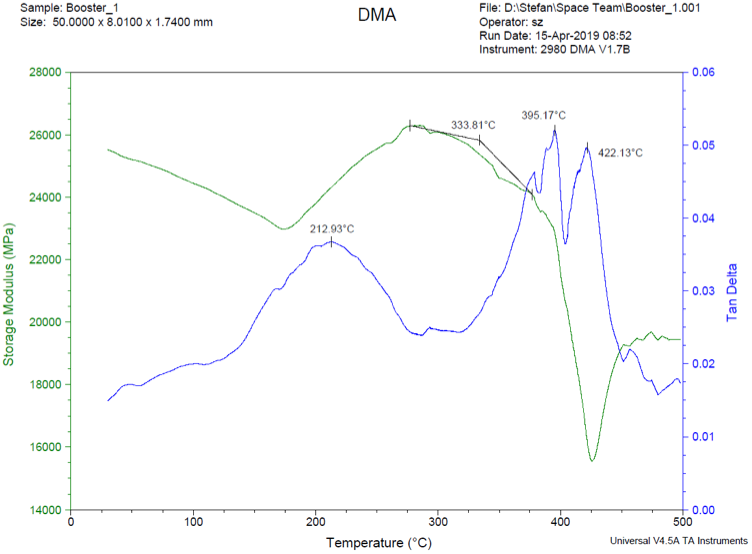
Comparing the measured curve of Figure 4 and 5 with that of the manufacturer one recognizes strong similarities. The diagram of the manufacturer starts from 160°C, that would be the area of our measurement, where the modulus increases again. The intersection of the tangents and the point of the lowest modulus differ only by 10 to 25°C. More important, however, is the temperature of the peak of the blue curve. Here the deviation is less than 1°C.
Conclusion of the DMA is that we have reached the theoretical material parameters due to the compliance with the given process parameters of the manufacturer. Different measuring methods can lead to different glass transition temperatures (cf. DSC compared to DMA).
Improvement of thermal properties
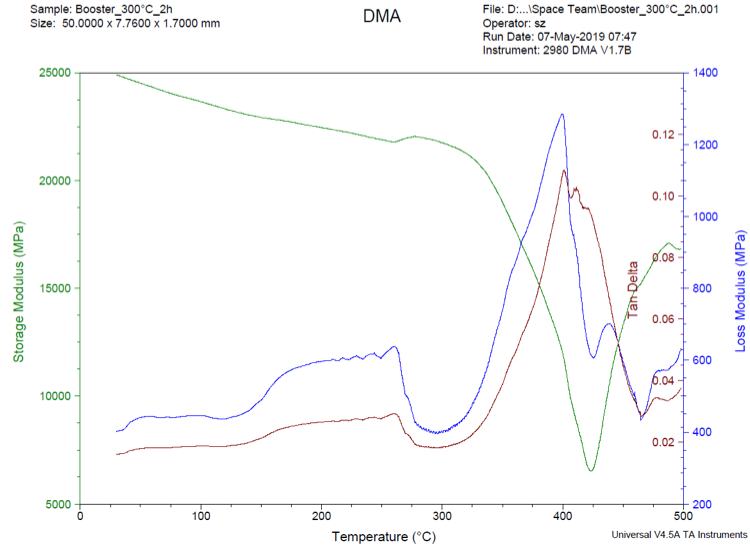
In order to further improve the material characteristics, an attempt was made to re-temper the samples with another heat treatment. The selected temperatures were 250°C (Figure 6) and 300°C (Figure 7), each with two hours hold time.
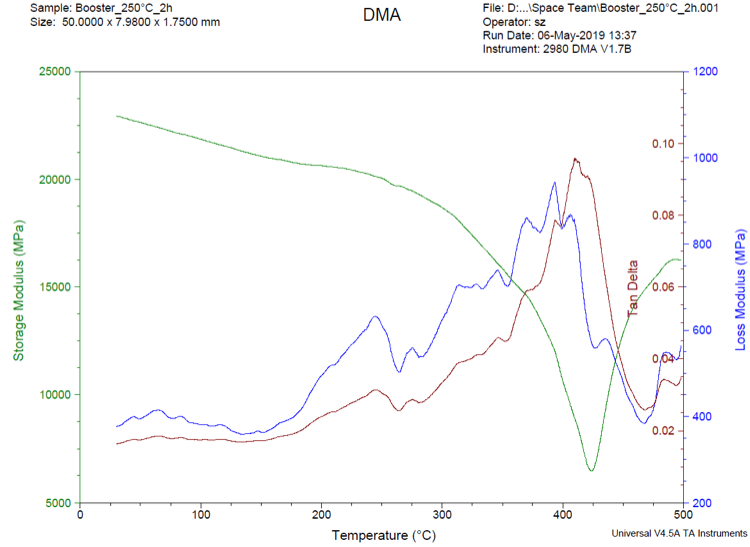
After annealing the samples, not only visually a darker color is recognizable, also in the measuring curves a change is visible. However, the peak values of the loss modulus are approximately at the same temperature. The absolute values are not meaningful here.
Conclusion: The annealing process according to the manufacturer data sheet is recommended. Changes in temperature lead to no improvement.
Thermogravimetric analysis (TGA)
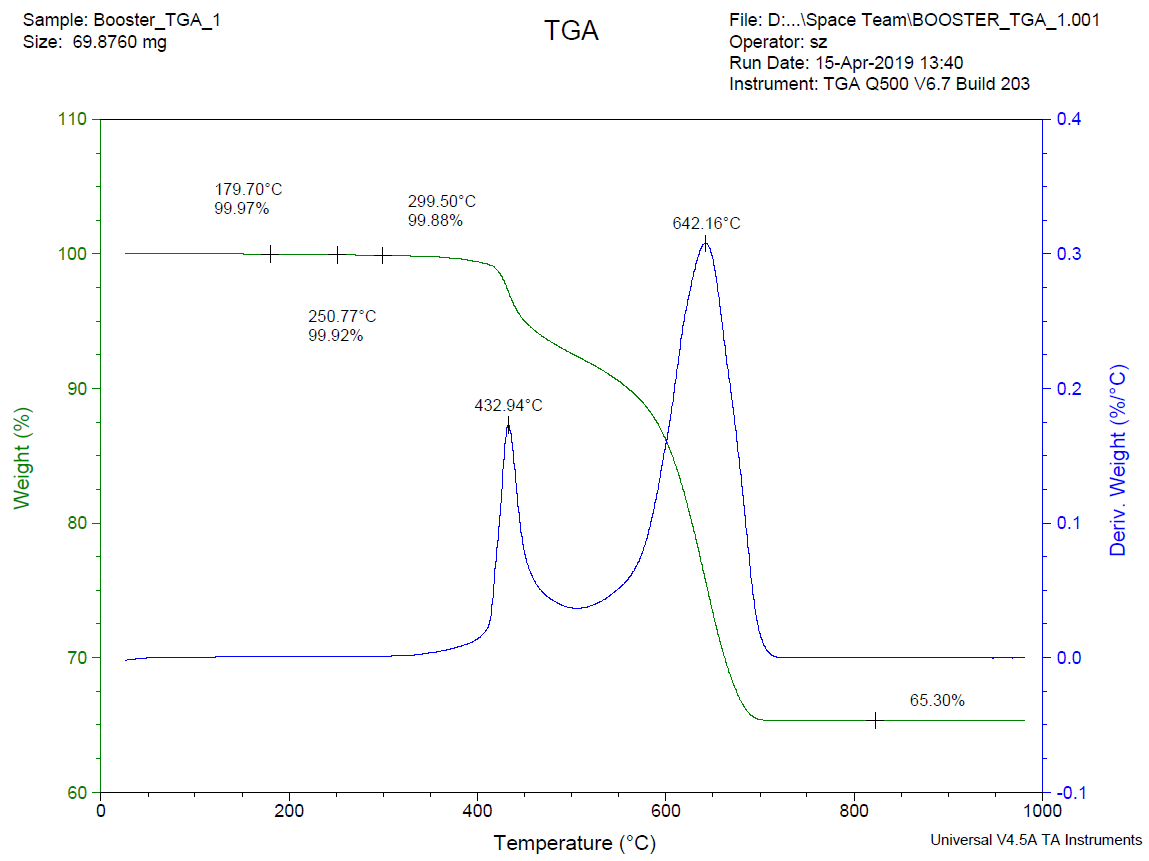
Due to changes in color during annealing at an elevated temperature, a thermogravimetric analysis (TGA) was performed. In Figure 8 the course of the weight over the temperature as well as the derivative is shown. As the temperature increases, the matrix oxidizes while the fibers remain stable at high temperatures.
It can be deduced from the diagram that the matrix loses weight during tempering at elevated temperature. The plateau above 700°C is the phase at which the matrix is completely removed and only fiber material is present. The fiber mass content thus corresponds to 65% of the total weight. Due to the different density of matrix and fiber results in a fiber volume fraction of about 50%.
The temperature of 432°C at the first peak of the derivative marks the decomposition temperature and fits well with the previous analyzes.
Conclusion
The material characteristics according to the manufacturer data sheet could be achieved with the specified heat treatments. The measured curves of the analysis show good agreement with those of the manufacturer. Changes in the heat treatments would not lead to any appreciable improvement, since the TG is very close to the decomposition temperature.